
| Rudy Flores · (619) 392-6714 · Real Estate Strategist, Realtor® · CalDRE #02257808 · Responsible Broker CalDRE #01481919
REAL ESTATE AGENT CORONADO
Seller Scorecard

Coronado Seller Scorecard: Monthly Market Statistics

Five public numbers Coronado owners ask about, gathered once a month from Zillow Research files, with a chart and a data file.

SELLER SCORECARD · NOVEMBER 2026

Each month Rudy pulls the five public numbers Coronado owners bring up first: what a typical home on the island is worth, how many listings trimmed their price, how many homes were for sale, how warm demand ran, and how close sales landed to asking across the San Diego metro. September 2026 is below, with the chart and the full data file.

Selling in Coronado this year? The Home Strategy Quiz is four quick questions, and Rudy sends back a plan built around your home.

Take the Home Strategy Quiz
The month at a glance

September 2026 in five numbers

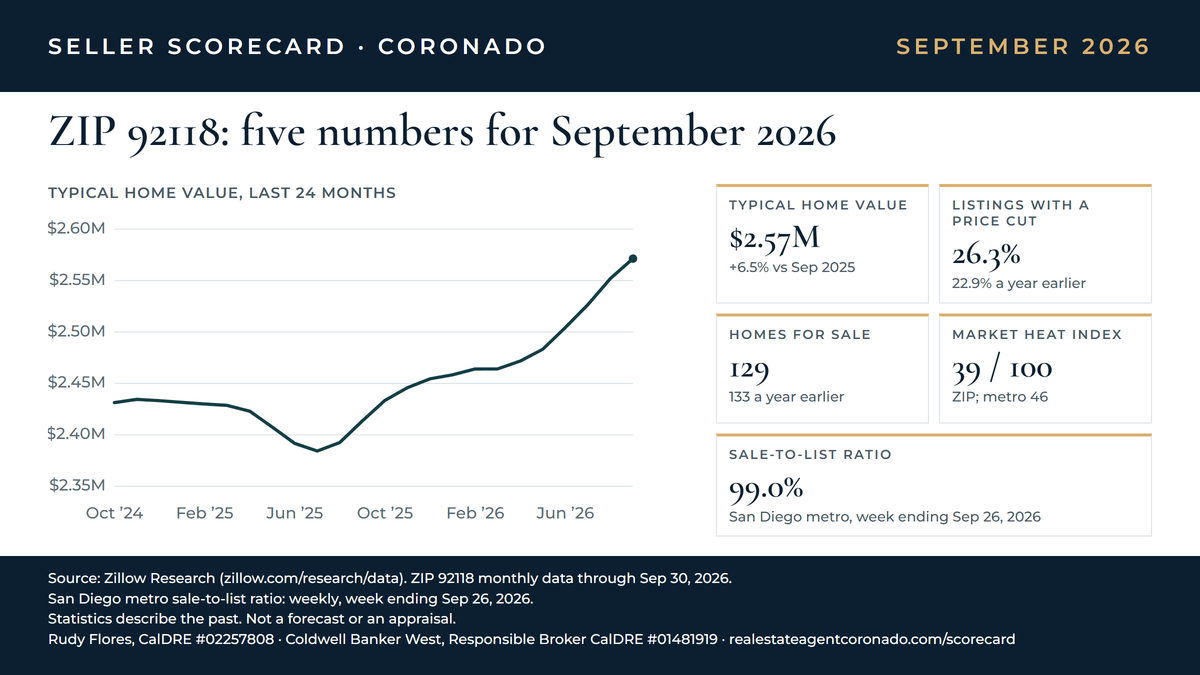
ZIP 92118 figures are Zillow's monthly series; the sale-to-list figure is weekly and covers the whole San Diego metro area.

Typical home value$2.57MZIP 92118, monthly. +6.5% since Sep 2025, when it was $2.41M.
Listings with a price cut26.3%ZIP 92118, monthly. 22.9% a year before (+3.4 points).
Homes for sale129ZIP 92118, monthly. 133 in Sep 2025.
Market heat index39 / 100ZIP 92118, monthly. Metro reading 46; a higher number leans toward sellers.
Sale-to-list ratio99.0%San Diego metro, weekly, for the week ending Sep 26, 2026. 98.7% a year earlier.
Two years of values

Typical home value, last 24 months

Zillow's typical value for ZIP 92118, month by month.

Typical home value, last 24 monthsZillow typical home value for ZIP 92118, Oct 2024 to Sep 2026.$2.35M$2.40M$2.45M$2.50M$2.55M$2.60MOct ’24Feb ’25Jun ’25Oct ’25Feb ’26Jun ’26
View the numbers
Typical home value by month
MonthZIP 92118
Sep 2026$2,571,340
Aug 2026$2,552,091
Jul 2026$2,526,557
Jun 2026$2,504,408
May 2026$2,483,237
Apr 2026$2,471,742
Mar 2026$2,464,141
Feb 2026$2,464,097
Jan 2026$2,458,301
Dec 2025$2,454,510
Nov 2025$2,445,957
Oct 2025$2,433,511
Sep 2025$2,413,674
Aug 2025$2,392,585
Jul 2025$2,384,299
Jun 2025$2,391,646
May 2025$2,407,610
Apr 2025$2,423,071
Mar 2025$2,428,669
Feb 2025$2,430,033
Jan 2025$2,431,515
Dec 2024$2,433,269
Nov 2024$2,434,531
Oct 2024$2,431,366
This month's chart

The September 2026 chart

The same five numbers on one image, with the source printed on it.

Coronado Seller Scorecard, September 2026: ZIP 92118 typical home value $2.57M (+6.5% in a year), 26.3% of listings with a price cut, 129 homes for sale, Zillow market heat index 39; San Diego metro sale-to-list 99.0%, week ending Sep 26, 2026, metro heat index 46. Source: Zillow Research.
Source: Zillow Research data (ZIP monthly; metro weekly), compiled by Rudy Flores, Coldwell Banker West, CalDRE #02257808. realestateagentcoronado.com/scorecard

To cite these numbers

Source: Zillow Research data (ZIP monthly; metro weekly), compiled by Rudy Flores, Coldwell Banker West, CalDRE #02257808. realestateagentcoronado.com/scorecard

For reporters and editors

Embed code

Download the chart (PNG, 1200 × 675)

Free to republish with the source line and link kept with it. Please don't crop the source line, change the numbers, or present them as a forecast. Zillow is cited as the data source; Zillow did not prepare or endorse this scorecard.

For a local comment, call or text Rudy at (619) 392-6714 or email [email protected].

What each number means

  • Typical home value. Zillow's estimate of a middle-of-the-market home: it reflects homes between the 35th and 65th percentile of value, across houses, condos and co-ops, smoothed and seasonally adjusted.
  • Listings with a price cut. Of the homes listed at some point during the month, the share whose asking price at month end sat below where it started the month.
  • Homes for sale. Every listing that was active at any time during the month, counted once.
  • Market heat index. Zillow's balance of for-sale supply against buyer demand. Higher readings mean the market tilts toward sellers, lower toward buyers.
  • Sale-to-list ratio. What homes sold for compared with their final asking price, averaged. Zillow publishes it for metro areas, so this one covers greater San Diego.

ZIP figures are monthly; the sale-to-list ratio is a weekly figure for the whole metro area, because Zillow publishes it for metro areas only.

Definitions, checked Nov 5, 2026: Zillow Research, Housing Data.

Put your own home next to these numbers

The record

Past scorecards

Each month as it was first published. Open a ZIP code to see every month on file.

ZIP 92118
ZIP 92118, month by month
MonthTypical value1-yr changePrice cutsHomes for saleHeat indexMetro sale-to-list
Sep 2026$2,571,340+6.5%26.3%1293999.0%
Aug 2026*$2,552,091+6.7%25.6%1342599.2%
Jul 2026*$2,526,557+6.0%22.2%1403899.4%
Jun 2026*$2,504,408+4.7%19.8%1384899.4%
May 2026*$2,483,237+3.1%18.6%1303999.3%
Apr 2026*$2,471,742+2.0%13.8%1124999.5%
Mar 2026*$2,464,141+1.5%12.8%945199.4%
Feb 2026*$2,464,097+1.4%7.5%885899.1%
Jan 2026*$2,458,301+1.1%9.2%956298.8%
Dec 2025*$2,454,510+0.9%9.7%1096798.6%
Nov 2025*$2,445,957+0.5%15.9%1226498.7%
Oct 2025*$2,433,511+0.1%19.1%1295598.7%
Sep 2025*$2,413,674−0.7%22.9%1334798.7%

* Months marked with an asterisk were added when the scorecard started, recomputed Nov 4, 2026 from the Zillow data available then.

Download every month (CSV)

Rudy's month-by-month write-ups: September 2026, August 2026, July 2026, June 2026.

Elsewhere in the county

Other monthly scorecards

The same five numbers, kept for other areas Rudy covers.

Questions

Questions about the scorecard

Is this a forecast?

No. Every number describes a month or a week that has already happened, as Zillow published it.

Why does one number cover the whole metro area?

Zillow publishes the sale-to-list ratio for metro areas and the nation, not for ZIP codes, so the scorecard uses the San Diego metro figure and labels it that way.

When does it update?

Zillow posts these files once a month, and its September 2026 release went up on Oct 16, 2026. A new month is added after the next release; a month already on this page keeps the figures it was first published with.

How can my home's price differ from the typical value?

The typical value describes the middle of the whole ZIP code. Your street, view, size and condition decide your own price, which is what a home value request from Rudy looks at.

May I use the chart?

Yes, with the source line and the link kept with it. The use terms are in the section for reporters above.

Numbers are a starting point. The Home Strategy Quiz turns them into a plan for your own Coronado home, in four questions.

Take the Home Strategy Quiz

Sources: Zillow Research. Statistics describe the past for a whole ZIP code or metro area; they are not an appraisal, a price opinion or a prediction.

Selling in Coronado This Year?

Rudy can put your home next to this month's numbers, with no pressure.

Get In Touch